About Azure Monitor
Azure Monitor is Microsoft's unified observability service for collecting, analyzing, visualizing and acting on telemetry from applications, infrastructure and Azure resources. It brings metrics, logs, traces and events into a common monitoring experience and can extend into hybrid and multicloud environments. Azure Monitor is a better fit for organizations that want Azure-native observability across many services than for teams that only need a small standalone application monitor. Cost planning matters because standard platform metrics and activity logs are included, while log ingestion, retention, export, alerts, web tests and other data-heavy features can create material usage charges.
What is included
Telemetry
| Signals | Collects and analyzes metrics, logs, traces and events across Azure and connected environments. |
|---|
Applications
| Application Insights | Provides application performance monitoring with OpenTelemetry integration for supported workloads. |
|---|
Availability
| Standard tests | Current single-step availability tests support TLS and SSL certificate checks, HTTP methods, custom headers and request data. |
|---|
Retirement
| URL ping tests | Application Insights URL ping tests retire September 30, 2026; Microsoft directs users to Standard tests. |
|---|
Migration
| HTTP Data Collector API | Support ends September 14, 2026. TLS 1.2 compliant ingestion can continue, but Microsoft recommends migration to the Logs Ingestion API. |
|---|
Containers
| Container Insights authentication | Legacy authentication is unsupported after September 30, 2026; Microsoft recommends managed identity authentication. |
|---|
Logs
| Linked storage identity | Since August 31, 2026, adding or updating linked customer-managed storage requires a managed identity on the Log Analytics workspace and storage permissions. |
|---|---|
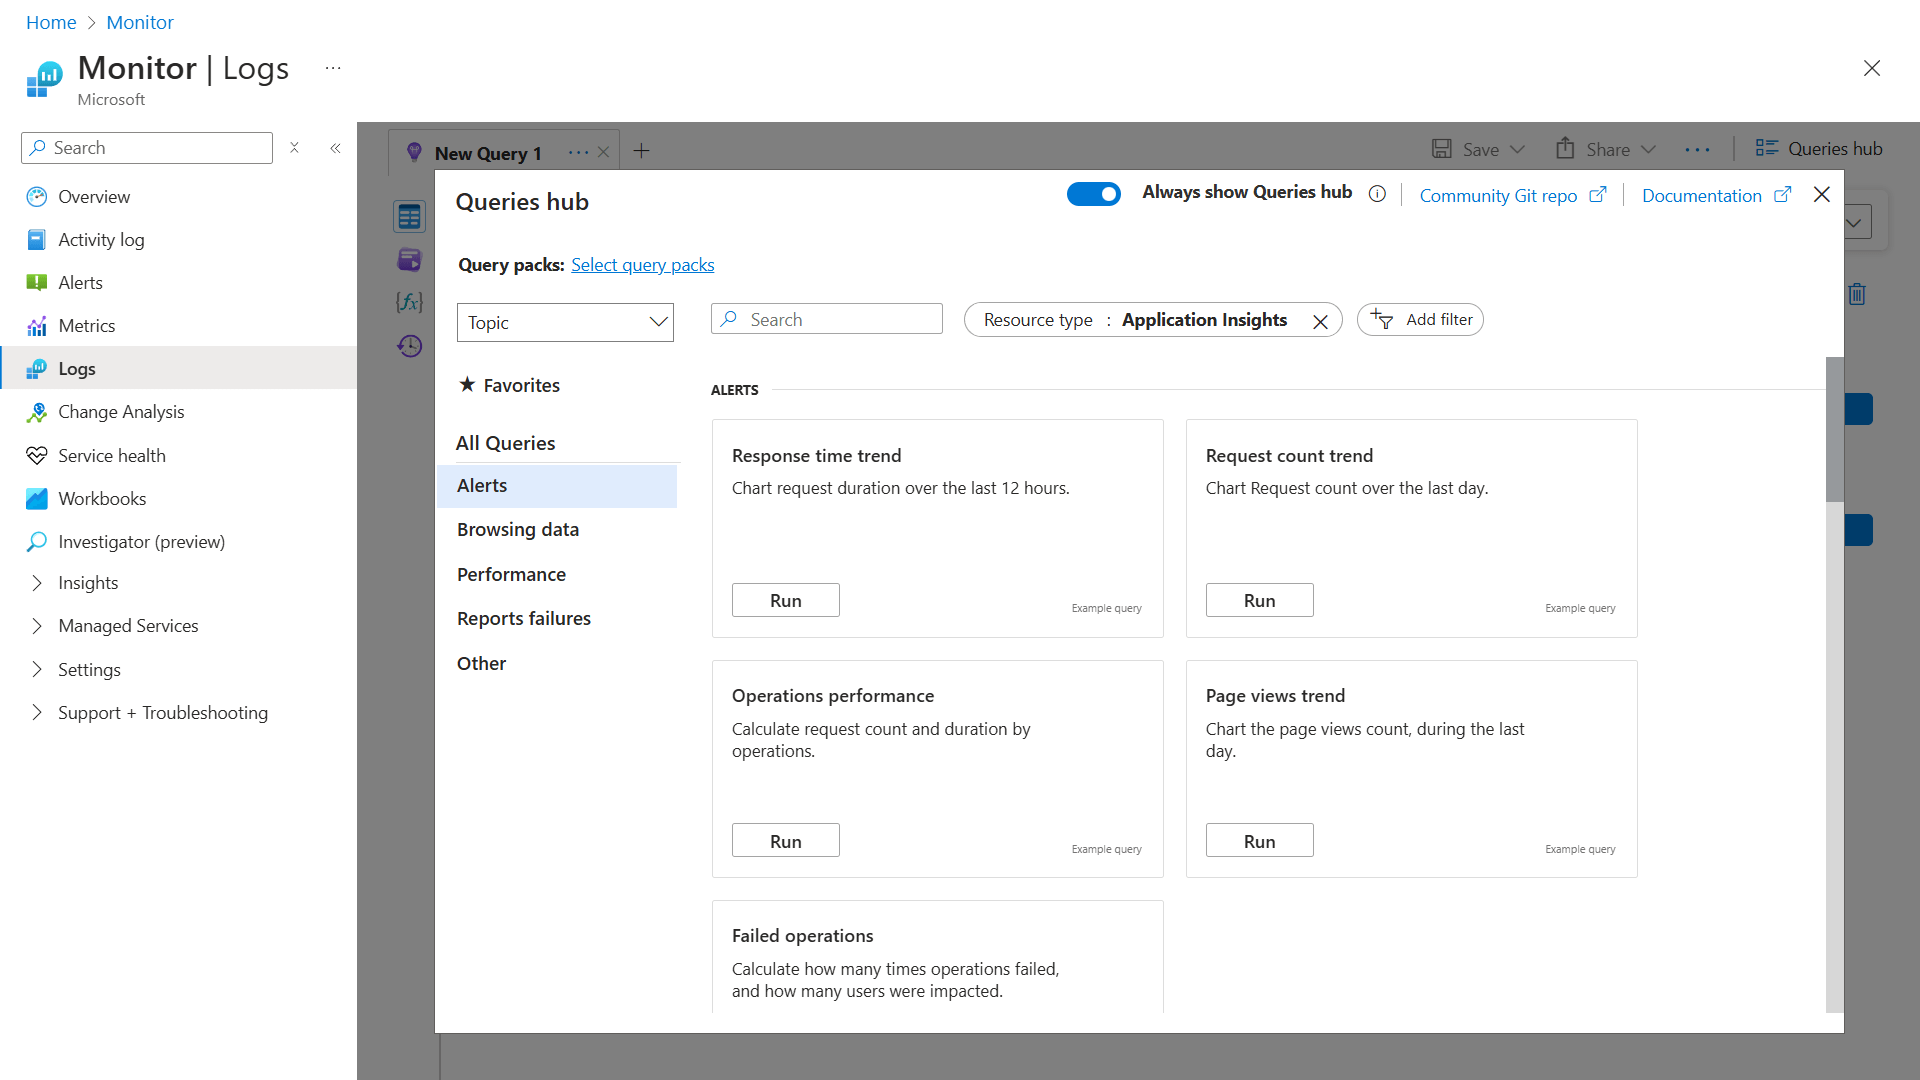
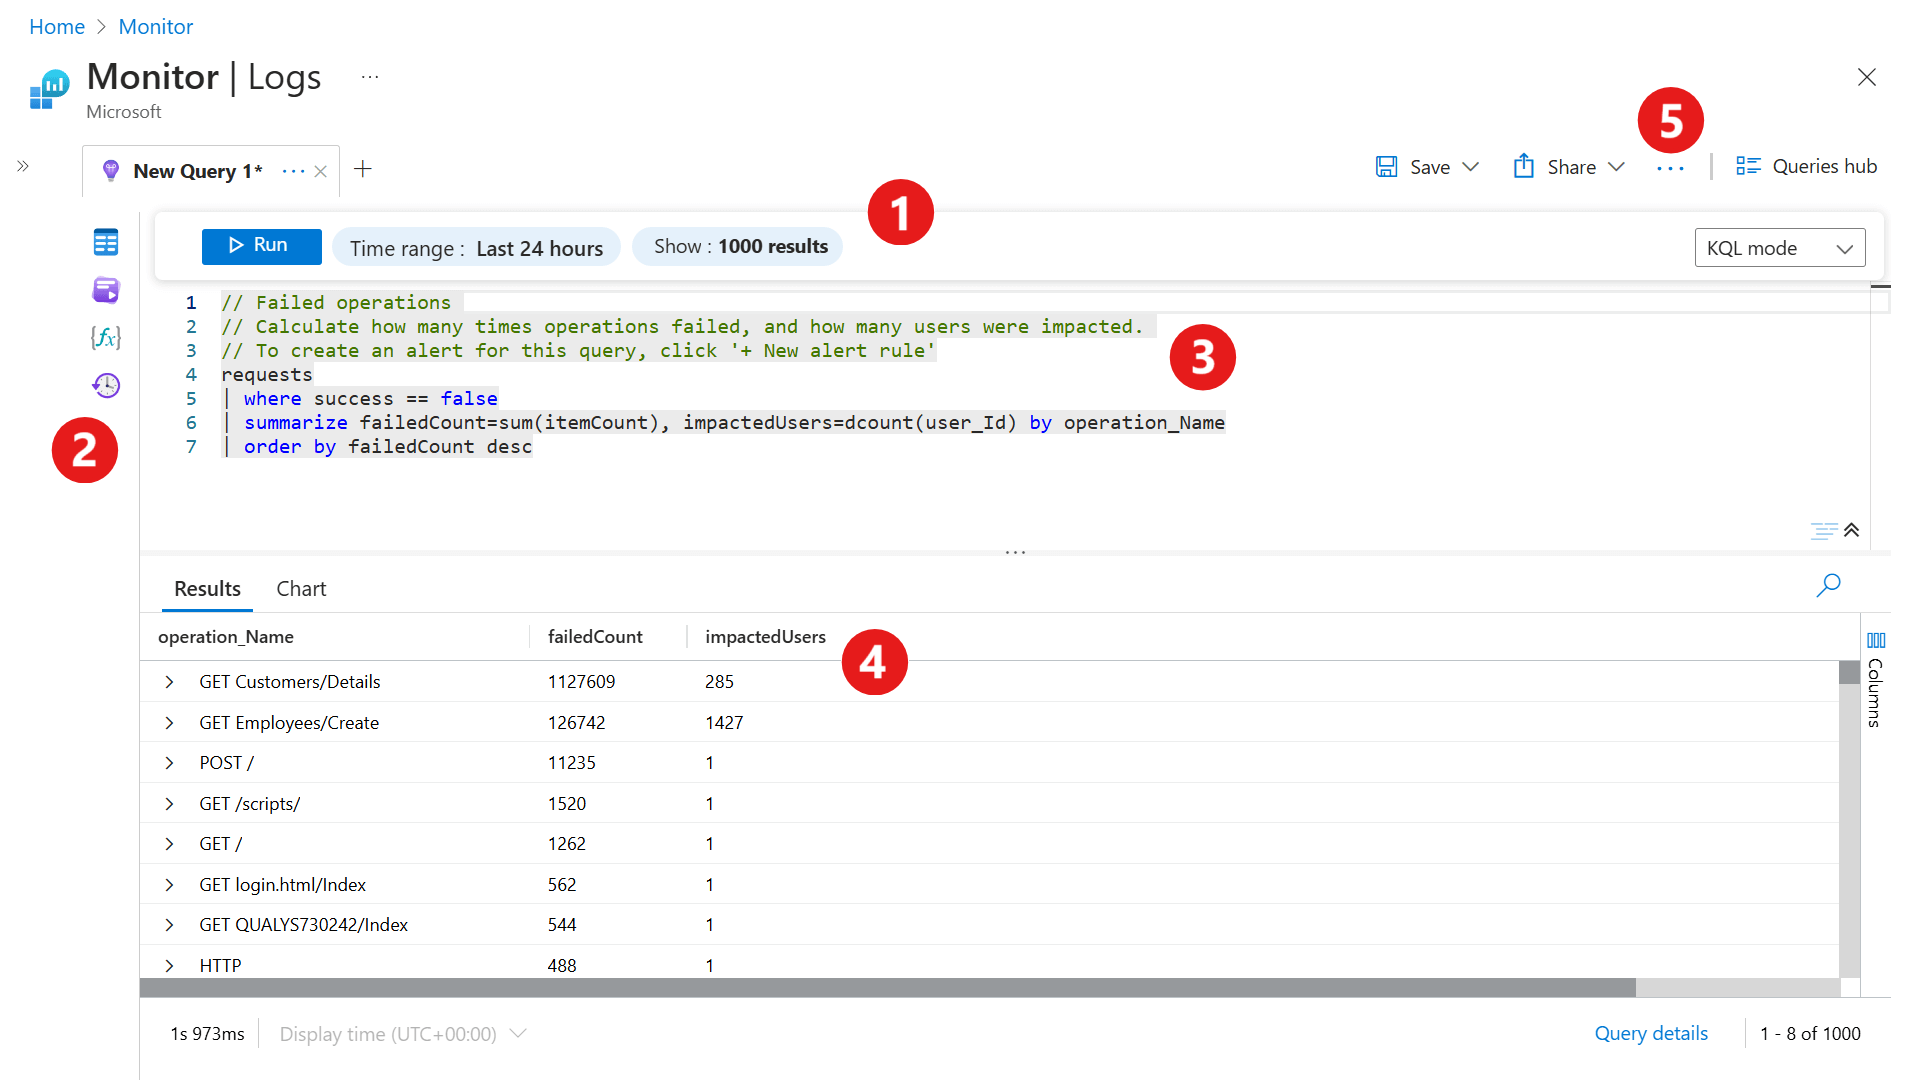
| Log Analytics | Uses Log Analytics workspaces and Kusto Query Language for log and trace analysis. |
Metrics
| Metrics platform | Supports native Azure metrics plus Prometheus and OpenTelemetry metrics in Azure Monitor workspaces. |
|---|
Response
| Alerts | Supports metric, log, activity log and other alert rules with action groups for notification or automation. |
|---|
Scale
| Logs Ingestion API per DCR | Microsoft documents 15,000 ingestion requests per minute and 50 GB per minute for each data collection rule. |
|---|
Hybrid
| Hybrid and multicloud | Can extend monitoring beyond Azure through Azure Arc, agents and Azure Monitor data collection capabilities. |
|---|
What is Azure Monitor used for?
Azure Monitor helps operations, platform, development and security teams understand whether applications and infrastructure are healthy, available and performing as expected. Microsoft positions it as the observability layer for Azure resources and also supports monitoring hybrid and multicloud environments through connected services and agents.
A typical deployment combines platform metrics for fast health signals, logs for detailed investigation, traces for application request flows and alerts for automated response. Teams can start from the monitoring blade of an Azure resource and then move into Azure Monitor tools when they need cross-resource analysis, dashboards, deeper queries or centralized alerting.
How do metrics, logs and traces differ in Azure Monitor?
Metrics are numerical time-series values optimized for fast detection, trending and alerting. They are useful for questions such as whether CPU usage, request latency or error rate has crossed a threshold. Logs are timestamped records that provide more context and are commonly analyzed in Log Analytics with Kusto Query Language. Traces help follow application requests and dependencies across services.
Microsoft separates the underlying data stores and query experiences. Azure Monitor workspaces can hold Prometheus and OpenTelemetry metrics, while Log Analytics workspaces store logs and traces. Buyers should not assume every telemetry type has the same retention, query model or price.
What does Application Insights add?
Application Insights is an Azure Monitor capability for application performance monitoring. Microsoft emphasizes OpenTelemetry integration, which gives developers a vendor-neutral way to instrument applications while still using Azure Monitor for analysis, dashboards, failures, dependencies and performance troubleshooting.
Application Insights is especially useful when the main question is what is happening inside an application rather than only whether the surrounding infrastructure is healthy. It can help teams investigate request rates, latency, failures and dependency behavior, but it does not remove the need for good instrumentation or application-level ownership.
What should teams do before URL ping tests retire?
Microsoft states that Application Insights URL ping tests will retire on September 30, 2026. Existing URL ping tests are scheduled to be removed from resources on that date. Organizations still using them should identify affected tests, recreate the required checks as Standard tests, validate the new tests and review their alert behavior before the retirement date.
Standard tests support capabilities that URL ping tests do not, including TLS and SSL certificate validation, proactive certificate lifetime checks, HTTP methods such as GET, HEAD and POST, custom headers and custom request data. The migration can also change cost because Microsoft states that enabled Standard tests are billable. Teams with large fleets of legacy ping tests should therefore model expected web-test charges before enabling replacements at scale.
What must users migrate before September 2026?
Microsoft has two additional Azure Monitor migration deadlines that affect older data collection and container monitoring configurations. Support for the legacy HTTP Data Collector API ends September 14, 2026. Microsoft's current migration guidance says this is not an ingestion hard stop for TLS 1.2 compliant clients: existing ingestion can continue, but the legacy API is unsupported apart from critical security fixes. Microsoft recommends moving to the Logs Ingestion API because it supports data collection rules, transformations, multiple destinations, schema control and role-based access control.
Container Insights also has a September 30, 2026 support cutoff for legacy certificate-based authentication. Microsoft now defaults Container Insights to managed identity authentication. Clusters still using legacy authentication after September 30, 2026 are unsupported until migrated. Teams operating AKS or other supported Kubernetes monitoring should identify legacy clusters and move them to managed identity before that date.
What changed for linked Log Analytics storage in August 2026?
Starting August 31, 2026, Microsoft requires a managed identity on a Log Analytics workspace when customers add or update linked customer-managed storage accounts for saved queries and saved log alert queries. The linked storage account must also grant the required role assignment to that managed identity. This means older runbooks or deployment templates that manage linked storage without a workspace identity can now fail when a link is created or changed.
Existing environments should validate managed identity assignments, storage permissions and infrastructure-as-code templates before making linked-storage changes. This requirement is separate from ordinary log ingestion and should not be confused with the broader Azure Monitor Agent or Logs Ingestion API migration paths.
How do alerts and automated actions work?
Azure Monitor can evaluate metrics, logs and other supported signals and trigger alert rules when defined conditions are met. Action groups can then notify people or connect the alert to an automated response. This is useful for service-health warnings, capacity issues, performance regressions and operational thresholds.
Microsoft currently documents default limits of 5,000 active metric alert rules per subscription, 5,000 active log alert rules per subscription and 100 activity log alert rules per subscription. The log-alert limit includes only 100 active rules with a one-minute frequency. Large estates should favor reusable multi-resource rules where appropriate instead of creating one rule for every individual signal.
How does Azure Monitor pricing work in September 2026?
Azure Monitor does not have one flat product price. Microsoft states that standard platform metrics and activity logs that are automatically enabled are provided at no direct charge. Major costs commonly come from log ingestion, retention, data export, web tests, alerts, notifications, Prometheus samples and selected Application Insights capabilities.
Microsoft currently offers three log ingestion plans: Auxiliary Logs, Basic Logs and Analytics Logs. Auxiliary and Basic include 30 days of retention, while Analytics includes 31 days by default, or 90 days when Microsoft Sentinel is enabled on the workspace. Analytics supports up to two years of interactive retention, and long-term retention can extend to 12 years. Querying Analytics Logs is included, while queries against Basic and Auxiliary Logs are billed by data scanned. Pricing guidance was rechecked on September 5, 2026. Buyers should classify telemetry by investigation value rather than send every table to the highest-cost plan.
What changed in Azure Monitor during 2026?
Several 2026 changes materially affect existing estates. Microsoft retired Azure Operations Center in August 2026 and directs customers to Azure Monitor for monitoring and analysis capabilities. Microsoft's current documentation also points to Azure Copilot Observability Agent for natural-language data exploration, guided investigations, Azure Monitor issues and autonomous alert operations.
Microsoft retired the Azure Diagnostics extension for Windows and Linux on March 31, 2026. WAD and LAD are no longer supported and should not be used for new deployments. Microsoft recommends migration paths based on the destination, including Azure Monitor Agent for supported collection scenarios, Log Analytics data export for Event Hubs, and OpenTelemetry metrics for guest OS performance counters and custom metrics. In June 2026, Microsoft also made OpenTelemetry metrics-based monitoring for Azure VMs and Azure Arc-enabled servers generally available. In August 2026, Auxiliary and Lake table-plan capabilities expanded, including support for more Azure tables and plan switching.
What are the main limits and operational tradeoffs?
Azure Monitor is broad, but that breadth can make architecture and cost management more complex. Different data types use different stores, query languages and retention models. Teams may need to understand Log Analytics, KQL, PromQL, data collection rules, workspaces, diagnostic settings and Application Insights rather than learning one simple monitoring screen.
Microsoft also documents specific alert and query limits. Metric alert rules support up to 10,000 metric time series per rule. Log alert query results cannot exceed 20 MB, and each stateless log alert rule can trigger up to 6,000 alerts per evaluation while a stateful rule can trigger up to 300 per evaluation. Application Insights supports up to 100 availability tests per resource. Azure Monitor managed service for Prometheus retains data for 18 months, and Logs Ingestion API traffic through a data collection rule is limited to 15,000 ingestion requests per minute and 50 GB per minute per DCR. These limits are unlikely to affect small deployments, but they matter when a platform team centralizes monitoring across very large subscriptions.
How does Azure Monitor fit with Microsoft Sentinel and Defender for Cloud?
Azure Monitor provides the observability data platform used by multiple Microsoft services. Microsoft states that the same data platform also supports services such as Microsoft Sentinel and Defender for Cloud. This can reduce duplicated data pipelines when organizations already use Microsoft's cloud security stack.
The products still solve different problems. Azure Monitor is centered on application and infrastructure observability, while Sentinel focuses on security information and event management and Defender for Cloud focuses on cloud security posture and workload protection. They should not be treated as interchangeable products.
Who is Azure Monitor best suited for?
Azure Monitor is a strong fit for organizations that operate a meaningful Azure estate and want deep native integration with Azure resources, Application Insights, Log Analytics, Prometheus metrics, alerting and Microsoft security tooling. It is also useful when platform teams need one place to standardize telemetry collection and operational visibility across many subscriptions.
It is less compelling when the company already has a mature cross-cloud observability platform that covers Azure well, or when a small application needs only a lightweight hosted monitor. In those cases, the operational cost of learning workspaces, collection rules, KQL and Azure-specific pricing may outweigh the benefit of deeper native integration.
Who should choose something else?
Teams with a small application and no broader Azure estate may prefer a simpler hosted monitoring tool that requires less Azure-specific configuration. Organizations standardized on another observability platform may also prefer to send Azure telemetry there rather than operate two parallel monitoring systems.
A third-party platform can make sense when a company needs one consistent observability layer across many clouds, SaaS services and on-premises systems and already has strong skills and contracts around that platform. Azure Monitor is strongest when Azure is a major part of the environment and teams value deep integration with Azure resources, Microsoft identity, Azure operations and Microsoft's broader cloud tooling.
Reviews
No reviews yet
Nobody has reviewed Azure Monitor here yet.